6MFF

HLA-DQ2-glia-omega1


Experimental Data Snapshot

  • Method: X-RAY DIFFRACTION
  • Resolution: 2.60 Å
  • R-Value Free: 
    0.250 (Depositor), 0.255 (DCC) 
  • R-Value Work: 
    0.209 (Depositor), 0.212 (DCC) 
  • R-Value Observed: 
    0.211 (Depositor) 

wwPDB Validation   3D Report Full Report


Ligand Structure Quality Assessment 

Created with Raphaël 2.3.0Worse 01 BetterLigand structure goodness of fit to experimental dataBest fitted NAGClick on this verticalbar to view details

This is version 1.4 of the entry. See complete history


Literature

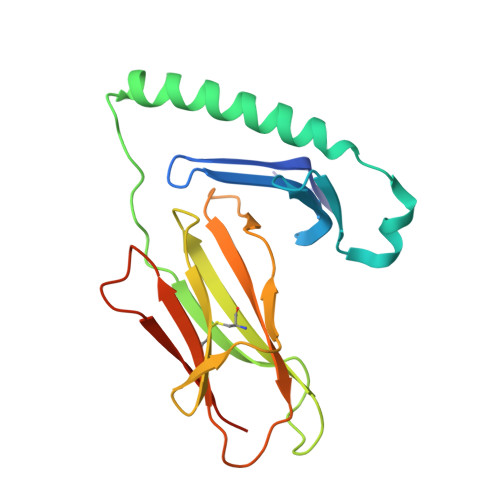
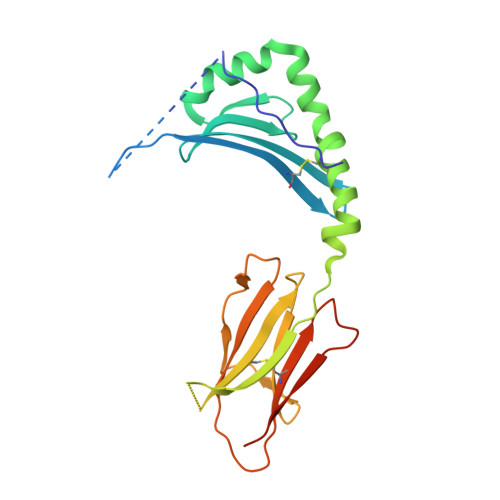
Discriminative T-cell receptor recognition of highly homologous HLA-DQ2-bound gluten epitopes.

Dahal-Koirala, S.Ciacchi, L.Petersen, J.Risnes, L.F.Neumann, R.S.Christophersen, A.Lundin, K.E.A.Reid, H.H.Qiao, S.W.Rossjohn, J.Sollid, L.M.

(2019) J Biological Chem 294: 941-952

  • DOI: https://doi.org/10.1074/jbc.RA118.005736
  • Primary Citation of Related Structures:  
    6MFF, 6MFG

  • PubMed Abstract: 

    Celiac disease (CeD) provides an opportunity to study the specificity underlying human T-cell responses to an array of similar epitopes presented by the same human leukocyte antigen II (HLA-II) molecule. Here, we investigated T-cell responses to the two immunodominant and highly homologous HLA-DQ2.5-restricted gluten epitopes, DQ2.5-glia-α1a (PFPQPELPY) and DQ2.5-glia-ω1 (PFPQPEQPF). Using HLA-DQ2.5-DQ2.5-glia-α1a and HLA-DQ2.5-DQ2.5-glia-ω1 tetramers and single-cell αβ T-cell receptor (TCR) sequencing, we observed that despite similarity in biased variable-gene usage in the TCR repertoire responding to these nearly identical peptide-HLA-II complexes, most of the T cells are specific for either of the two epitopes. To understand the molecular basis of this exquisite fine specificity, we undertook Ala substitution assays revealing that the p7 residue (Leu/Gln) is critical for specific epitope recognition by both DQ2.5-glia-α1a- and DQ2.5-glia-ω1-reactive T-cell clones. We determined high-resolution binary crystal structures of HLA-DQ2.5 bound to DQ2.5-glia-α1a (2.0 Å) and DQ2.5-glia-ω1 (2.6 Å). These structures disclosed that differences around the p7 residue subtly alter the neighboring substructure and electrostatic properties of the HLA-DQ2.5-peptide complex, providing the fine specificity underlying the responses against these two highly homologous gluten epitopes. This study underscores the ability of TCRs to recognize subtle differences in the peptide-HLA-II landscape in a human disease setting.


  • Organizational Affiliation

    From the Department of Immunology, University of Oslo and Oslo University Hospital-Rikshospitalet, 0372 Oslo, Norway.


Macromolecules
Find similar proteins by:  (by identity cutoff)  |  3D Structure
Entity ID: 1
MoleculeChains Sequence LengthOrganismDetailsImage
HLA class II histocompatibility antigen, DQ alpha 1 chain190Homo sapiensMutation(s): 0 
Gene Names: HLA-DQA1
UniProt & NIH Common Fund Data Resources
Find proteins for P01909 (Homo sapiens)
Explore P01909 
Go to UniProtKB:  P01909
PHAROS:  P01909
GTEx:  ENSG00000196735 
Entity Groups  
Sequence Clusters30% Identity50% Identity70% Identity90% Identity95% Identity100% Identity
UniProt GroupP01909
Glycosylation
Glycosylation Sites: 2Go to GlyGen: P01909-1
Sequence Annotations
Expand
  • Reference Sequence
Find similar proteins by:  (by identity cutoff)  |  3D Structure
Entity ID: 2
MoleculeChains Sequence LengthOrganismDetailsImage
MHC class II HLA-DQ-beta-1 - DQ2-glia-omega1 chimeric proteinB [auth C]226Homo sapiensMutation(s): 0 
UniProt
Find proteins for O19712 (Homo sapiens)
Explore O19712 
Go to UniProtKB:  O19712
Entity Groups  
Sequence Clusters30% Identity50% Identity70% Identity90% Identity95% Identity100% Identity
UniProt GroupO19712
Sequence Annotations
Expand
  • Reference Sequence
Experimental Data & Validation

Experimental Data

  • Method: X-RAY DIFFRACTION
  • Resolution: 2.60 Å
  • R-Value Free:  0.250 (Depositor), 0.255 (DCC) 
  • R-Value Work:  0.209 (Depositor), 0.212 (DCC) 
  • R-Value Observed: 0.211 (Depositor) 
Space Group: C 2 2 21
Unit Cell:
Length ( Å )Angle ( ˚ )
a = 93.87α = 90
b = 96.61β = 90
c = 107.05γ = 90
Software Package:
Software NamePurpose
PHENIXrefinement
XDSdata reduction
SCALAdata scaling
PHASERphasing

Structure Validation

View Full Validation Report


Ligand Structure Quality Assessment 

Created with Raphaël 2.3.0Worse 01 BetterLigand structure goodness of fit to experimental dataBest fitted NAGClick on this verticalbar to view details

Entry History 

Deposition Data

Revision History  (Full details and data files)

  • Version 1.0: 2018-11-21
    Type: Initial release
  • Version 1.1: 2018-12-12
    Changes: Data collection, Database references
  • Version 1.2: 2019-01-30
    Changes: Data collection, Database references
  • Version 1.3: 2020-07-29
    Type: Remediation
    Reason: Carbohydrate remediation
    Changes: Data collection, Derived calculations, Structure summary
  • Version 1.4: 2024-10-23
    Changes: Data collection, Database references, Structure summary